

|
|
|
This example demonstrates the use of image synthesis und animation of
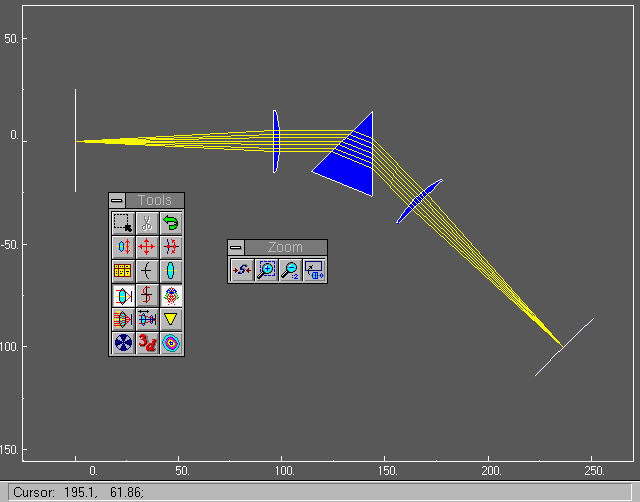
elements. A simple prism spectrograph is made up of 2 lenses and a dispersion
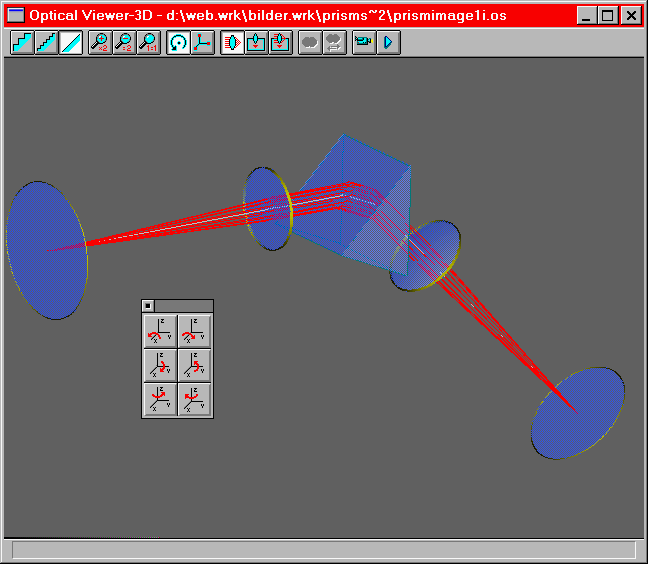
prism. Fig. 3-1 shows the 2D view of the design, Fig 3-2 an 3D view. A bundle
of beams is drawn for 546 nm. The two lenses project the object plane onto the
image plane (1:1).

Fig 3-1: 2D view of a prism spectrograph

Fig 3-2: 3D view of a prism spectrograph. Note tool bar for moving the system
view in space

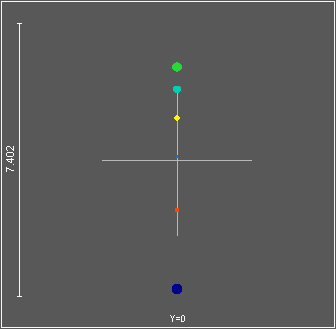
Fig 3-2: Spot diagram prism spectrograph (False colors)
|
The spot diagram (Fig. 3-3) of the image plane shows several spots
corresponding to the wavelengths 450 nm, 500 nm, 550 nm, 600 nm , 650 nm, and
700 nm. Colors are false colors, deep blue belongs to the shortest wavelength
defined for the particular optical system. Due to the dispersion several spots
are visible. Note the variation in spot size caused by chromatic aberration.
|
|
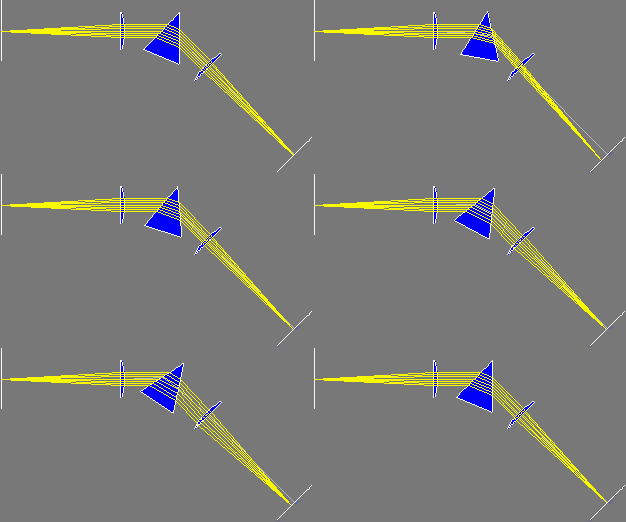
Animation of optical elements (Fig. 3-4) is used to demonstrate positioning of
prism to angle of minimum deviation where light beam traverses prism
symmetrically. Animation feature of VOB++ and VOB Pro may be used to define
shifting and rotating of optical elements. Similarly an optical beam may be
moved over the entrance pupil either by angle or by position depending on type
of optical system.
|

Fig 3-4: Animation demonstrates prism angle of minimum deviation for 545 nm
|
More samples?
The trial version of VOB Pro with Micro Optics plug-in contains hundreds of samples covering nearly any application of optical design programs. Use these samples as starting points for own designs.
See the Feature Table for a summary of features supported in each edition.
|
|


