


|
|
Sample: Prism Spectrograph 2
VOB Virtual Optical Bench Program Series
A typical line spectrum of a
prism spectrograph
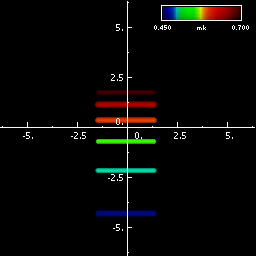
can be produced by image synthesis. The entrance slit is simulated by a bitmap
(Fig 3-5a) at the object plane of the system. The resulting spectrum is shown
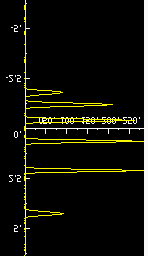
in figure 3-5b and the corresponding energy spectrum in figure 3-5c.

|
|
|
|
Fig. 3-5a: Bitmap of entrance slit of prism spectrograph (object)
|
Fig. 3-5b: Image of entrance slit of prism spectrograph (false colors)
|
Fig. 3-5b: Energy spectrum
|
|
The upper example (Fig 3-5) is made disregarding the features of the detector.
VOB++ and VOB pro obtain electro-optical features. Several detector and scanner
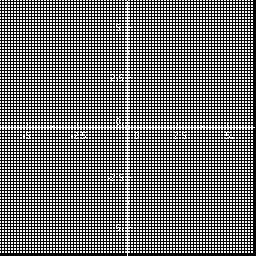
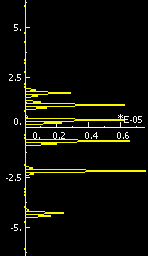
types (electronical and mechanical) can be simulated. In fig. 3-6 a matrix
detector is shown, like a CCD array used in TV cameras. Due to the
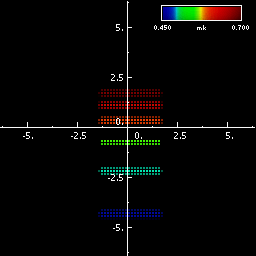
comparatively coarse matrix the resulting spectrum (Fig. 3-7b, c) shows typical
structures, which affect the resolution of the spectrograph.
|
|
|
Fig. 3-6: Image of matrix detector with diode size of 0.10 * 0.10 and center to
center distance of 0.15 * 0.15 (arbitrary units)
|

|
|
|
|
Fig. 3-7a: Bitmap of entrance slit of prism spectrograph (object)
|
Fig. 3-7b: Image of entrance slit of prism spectrograph as sampled by matrix
detector of Fig. 3-6 (false colors)
|
Fig. 3-7b: Energy spectrum as sampled by matrix detector of Fig. 3-6
|
|


